Getting Started With Roslyn Analyzers
A Hands-On Guide to Building and Understanding Roslyn Analyzers

I am a highly motivated and innovative software engineer with almost a decade of professional experience in software design and development. My main interests include architecting performant cloud-native solutions and optimizing the development experience for myself and my colleagues. I have extensive knowledge and understanding of the .NET ecosystem, including ample expertise in cloud technologies such as Microsoft Azure. In my spare time, I enjoy improving myself and the community by contributing to free and open-source software.
This article will focus on the most basic setup needed to create and use a Roslyn analyzer. Starting with an empty solution, we will go through the necessary configuration to develop and utilize a Roslyn analyzer.
The last article ended with the words, "let's write some code." While I'm all for writing code, perhaps some purpose is needed first. One of the goals of an open compiler platform is, for sure, the ability to extend and modify it to solve your problems. I have problems (yikes!).
First, define the problem
While this makes complete sense when written by a stranger on a blog post, it is always good to be reminded that to solve a problem, you must first know what the problem is (duh, get on with it already).
Let's say you get employed at a cool, trending company with a product wholly written in the latest flavor of C#. It's your first day on the job with your brand new 14" Mac, and a colleague gives you a link to the codebase you will be working on. You Set everything up, open up your favorite code editor, and load Program.cs . You see this.
// this is the entrypoint to the CoolCorp application


var builder = WebApplication.CreateBuilder(args);


// Add services to the container.
builder.Services.AddRazorPages();
builder.Services.AddControllersWithViews();


var app = builder.Build();

// Configure the HTTP request pipeline.
And then the screen ends. There is no more vertical space on your brand-new MacBook. It has been completely eaten up by empty lines and, gulp, whitespace!
Now, just forget about the handy scrolling capabilities of that state-of-the-art haptic feedback trackpad thingy. You hate that you can only see 4 relevant lines of code on your screen. It hurts, and you want to... No, you need to fix it now!
The goal is to quickly turn the above monster into something more concise, clean, and structured, like so.
// this is the entrypoint to the CoolCorp application

var builder = WebApplication.CreateBuilder(args);

// Add services to the container.
builder.Services.AddRazorPages();
builder.Services.AddControllersWithViews();

var app = builder.Build();

// Configure the HTTP request pipeline.
if (!app.Environment.IsDevelopment())
{
    app.UseExceptionHandler("/Error");
}

app.UseStaticFiles();

app.MapDefaultControllerRoute();
app.MapRazorPages();

app.Run();
Bonus, you wish to punish the people writing such code, so you also want to make sure the build fails if there are multiple sequential empty lines anywhere in the solution.
Great, we have a problem to solve. To be entirely honest, you could just browse the Roslyn documentation and find the diagnostic with ID IDE2000. Then set the severity to error and grab a cold beverage with one of your normal non-developer friends who don't enjoy torturing themselves with coding abstractions at 3 AM on Saturday.
No? No! Let's dive in!
Set up the environment - take one
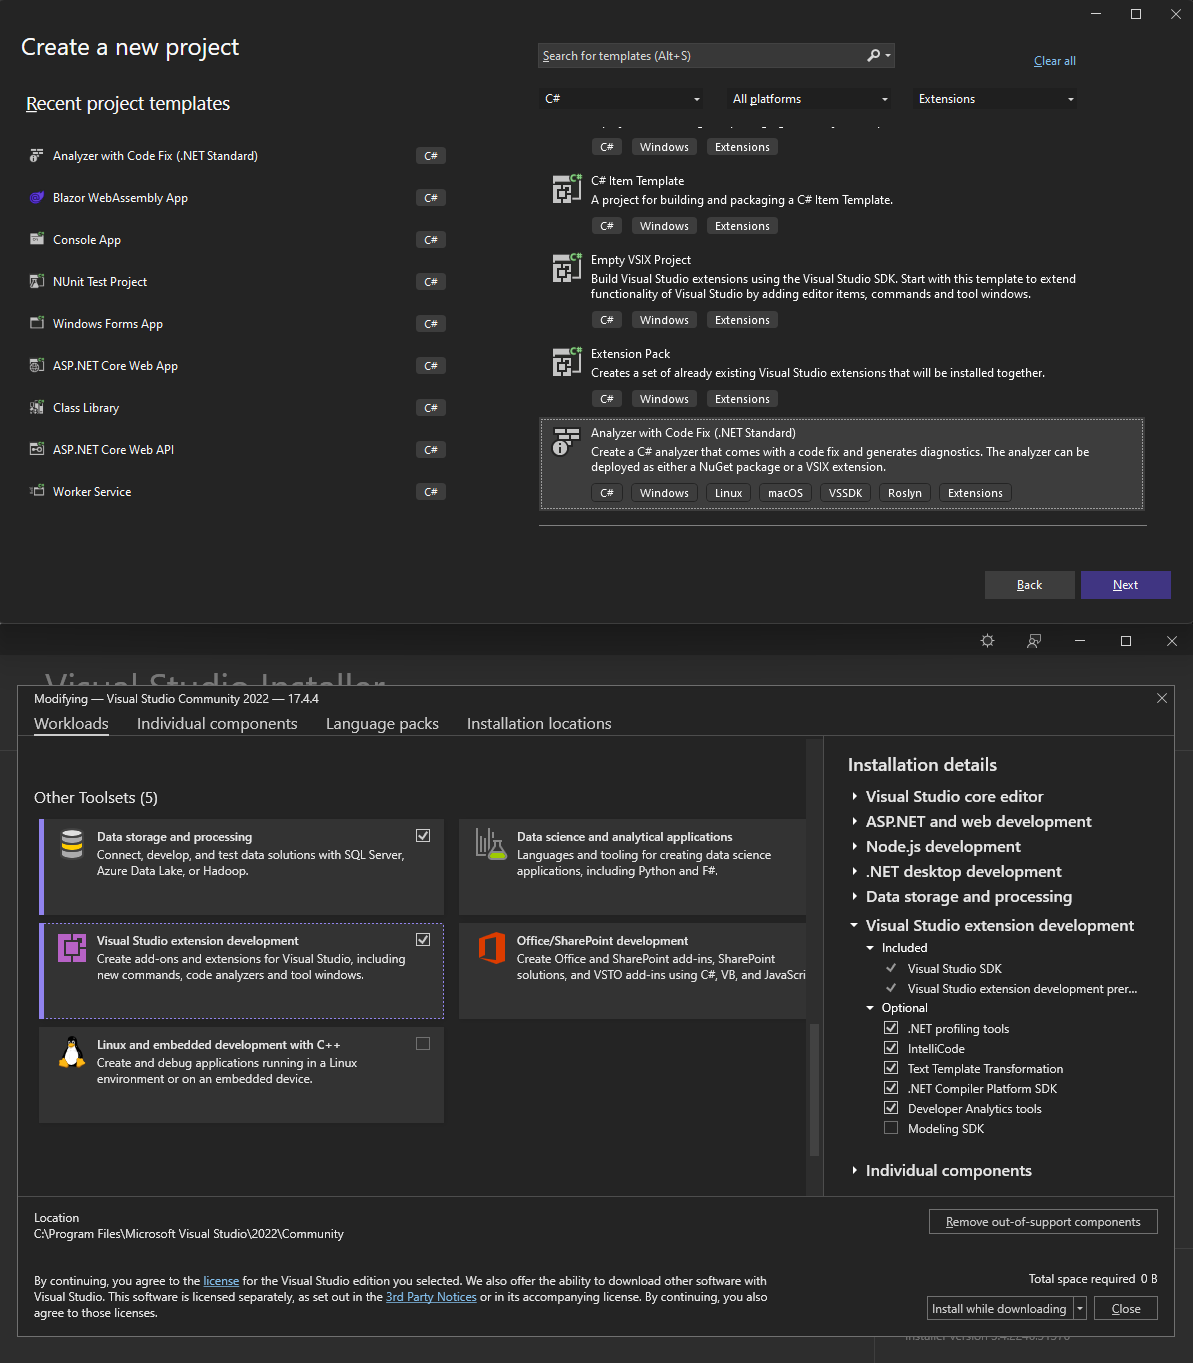
There are several ways to start developing Roslyn extensions. A straightforward way to start is to open up your latest Visual Studio 2022, find the Analyzer with Code Fix (.NET Standard) template, and dive into it.
Of course, you must ensure that you have installed the necessary workloads first (hint, hint Visual Studio extension development workload with the optional .NET Compiler Platform SDK ☑ component).
Once you create a project, you are greeted with an example analyzer and code fix, including the NuGet or a VSIX Visual Studio extension boilerplate code.
Project setup, as well as the means of distribution, are all essential things to consider, but we will dive into that topic at a later time. Right now, we need to get up and running ASAP. Your boss is watching, and the haptic feedback trackpad is about to give. To get up and running fast, we are going to start from scratch, literally (I know, I know... bear with me).
Set up the environment - take two
Okay, let's start with an empty solution. I'll let you figure out the best way to create it. My preference is always dotnet new sln.
Create a basic console application
While waiting on your Mac to load the entire CoolCorp solution, let's create a simple demo console app dotnet new console -n DemoConsoleApp. We will use this console application to quickly get feedback on our analyzer (no, you shouldn't use a console application to test your work).
Side note; if you are new to
dotnetand are still not impressed by the advances made in the last couple of years, just rundotnet run --project DemoConsoleApp, and you have a working console application ready to run in a single step. Mind you, the only file in the project has a single line of syntax written in it.Hello, World!
Create the analyzer project outline
Create a new class library project and name it something cool like NewLinesAreRelevantSyntaxTooAnalyzer.csproj (or don't, please). Roslyn components should target the netstandard2.0 TFM to ensure that analyzers load in various runtimes available today (mono, .NET Framework, and .NET Core).
Since we are already adding new functionalities to our solution, let's reference the packages needed to create an analyzer.
dotnet new classlib -f netstandard2.0 --langVersion latest -n EmptyLinesAnalyzerAndCodeFix
dotnet add EmptyLinesAnalyzerAndCodeFix package Microsoft.CodeAnalysis.CSharp
dotnet add EmptyLinesAnalyzerAndCodeFix package Microsoft.CodeAnalysis.Analyzers
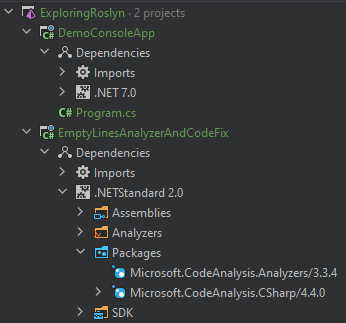
If everything worked out, the structure of the solution should look like this.
There is now only a single piece of the puzzle missing. We need to reference the analyzer in our DemoConsoleApp.
To do that, open the DemoConsoleApp.csproj, and create an <ItemGroup> that adds a project reference to the analyzer. The file should look something like this.
<Project Sdk="Microsoft.NET.Sdk">
    <PropertyGroup>
        <OutputType>Exe</OutputType>
        <TargetFramework>net7.0</TargetFramework>
    </PropertyGroup>

    <ItemGroup>
        <ProjectReference Include="..\EmptyLinesAnalyzerAndCodeFix\EmptyLinesAnalyzerAndCodeFix.csproj" OutputItemType="Analyzer" ReferenceOutputAssembly="false" PrivateAssets="All"/>
    </ItemGroup>
</Project>
What we just did was referenced our analyzer from the console project. We then instructed the compiler that the referenced project should be used as a part of the project analysis. Additionally, we told the compiler that our console application will not be referencing the outputs of the analyzer (but we still need it to be built beforehand). If you wish to learn about other specifics of referencing projects, have a look at common MSBuild project items and how to control dependency assets.
We just achieved the ability to consume the analyzer from the same solution that the analyzer is being developed in (just hit rebuild - and read up on the wonders of MEF parts and dynamic recomposition if you ever need to reload the solution and have no idea why).
Let's take the analyzer for a spin!
A basic diagnostic analyzer
Head over to our analyzer class library and create a new class named EmptyLinesAnalyzer.cs. There are a couple of namespaces we will be using. Make sure that the following are included.
using System.Collections.Immutable;
using System.Diagnostics.CodeAnalysis;
using Microsoft.CodeAnalysis;
using Microsoft.CodeAnalysis.Diagnostics;
Since we are positive we have no idea what VisualBasic even looks like, we will add an attribute specifying that the created class will be a [DiagnosticAnalyzer(LanguageNames.CSharp)].
Next, we need is to describe what the diagnostic we are producing will report. We need to instantiate a very simple DiagnosticDescriptor (the one from the Microsoft.CodeAnalysis namespace) to report the relevant information to the developer using our analyzer.
// ...
[DiagnosticAnalyzer(LanguageNames.CSharp)]
public class EmptyLinesAnalyzer : DiagnosticAnalyzer
{
    internal const string DiagnosticId = "DM0001";
    private static readonly DiagnosticDescriptor Rule = new DiagnosticDescriptor(
        id: DiagnosticId,
        title: "I work!",
        messageFormat: "I Work!",
        category: "Design",
        defaultSeverity: DiagnosticSeverity.Error,
        isEnabledByDefault: true,
        description: "I work!");

    public override ImmutableArray<DiagnosticDescriptor> SupportedDiagnostics
        => ImmutableArray.Create(Rule);

    public override void Initialize(AnalysisContext context)
    {
        //...
    }
}
If you recall from the first post in this series, analyzers can interact with several stages of compilation. Our use case will involve only syntax analysis. The diagnostics, however, will always point to a location in the analyzed syntax.
I would invite you to read up on syntax analysis, but for now, just imagine our console application has a single syntax tree (the contents of Program.cs ). That tree represents every keyword, variable, expression, comment, and every other character within this file.
Each token in that syntax tree has a span. The character index at which the node begins and its length. The most simple job of an analyzer is to find the location of a code issue (the hard part) and report it to the compiler (the easy part).
Let's do the easy part first.
public override void Initialize(AnalysisContext context)
{
    context.ConfigureGeneratedCodeAnalysis(GeneratedCodeAnalysisFlags.None);
    context.RegisterSyntaxTreeAction(context =>
    {
        var location = Location.Create(context.Tree, TextSpan.FromBounds(0, context.Tree.Length));
        var diagnostic = Diagnostic.Create(Rule, location);
        context.ReportDiagnostic(diagnostic);
    });
}
We just instructed the compiler to report an error for any syntax tree encountered and that the error should span the entire document.
Side note; you would not believe how many autogenerated files exist in a single-line console application.
AssemblyInfo,AssemblyAttributes,GlobalUsings, you name it. We can ensure this code is not analyzed by setting theGeneratedCodeAnalysisFlagstoNone.
Okay, if all the semicolons are in place, rebuilding the solution will most certainly produce an error.
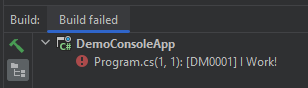
Now try to remember the last time you were happy that your code didn't work?!
Anyway, we have a real problem to solve now...
Implement empty lines analyzer logic
Since solving this problem was not intended to be a part of the article (what?!), I will try to leave you with some hints on how to attempt this yourself. If, however, you feel like the extra tinker time is not worth it, I will include a link to a fully working analyzer at the bottom (don't you dare touch that haptic feedback trackpad now!).
To try and solve this problem, we first need to know what parts of the syntax tree the empty lines usually occur. The fastest way to see this is by inspecting the syntax tree of the program code. There is handy tooling already available that allows you to traverse a live syntax tree either in Visual Studio, Rider, or even online.
Most of the empty lines are a part of syntax trivia. Trivia is a special kind of token found in the syntax tree. It contains syntactically insignificant parts of your code, such as comments, preprocessing directives, whitespaces, and, bingo, new lines.
One way to start is to traverse all leaf tokens in a syntax tree. Once a token with leading trivia is encountered, we need to verify if it is structured so that it contains multiple subsequent empty lines. If found, we need to report the location to the compiler (and we already know how to do that).
Side note; we should define what multiple empty lines truly mean. Are these just sequential
\ncharacters? How about platform-specific line terminators such as\r\n? Do we ignore thewhitespaceand\tcharacters between new lines?
One way we could implement the above solution is to analyze each observed syntax tree in the following way.
private void Recurse(SyntaxTreeAnalysisContext context, SyntaxNode node)
{
    foreach (var nodeOrToken in node.ChildNodesAndTokens())
    {
        if (nodeOrToken.IsNode)
            Recurse(context, nodeOrToken.AsNode());
        else if (nodeOrToken.IsToken)
            AnalyzeToken(context, nodeOrToken.AsToken());
    }
}

private void AnalyzeToken(SyntaxTreeAnalysisContext context, SyntaxToken token)
{
    if (!token.HasLeadingTrivia)
        return;
    // ...
}
After finding and reporting all locations at which multiple subsequent empty lines occur, the analyzer will ensure that the compilation process encounters an exception and report the diagnostic we created.
One more thing
You might notice that your IDE will begin to issue warnings that a project containing analyzers or source generators should specify the property <EnforceExtendedAnalyzerRules>true</EnforceExtendedAnalyzerRules>. The compiler platform comes equipped with a plethora of analyzers intended to help with developing and extending the Roslyn compiler.
When the abovementioned property is set in your EmptyLinesAnalyzerAndCodeFix.csproj, these analyzers start analyzing your analyzer and offer valuable guidance on properly handling common scenarios when developing for Roslyn.

To sum up
If you managed to follow through to the end, you should have a working analyzer that does a couple of really interesting things.
It is capable of identifying locations that are basically empty space,
it can fail the build when such locations are found within your codebase and offer information on where to find them, and
is fully equipped to annoy your coworkers to no avail.
That may present a challenge but worry not. In the following article, we will create an accompanying code fix that can fix issues reported by our empty lines analyzer.
And, as promised, check out the denisekart/exploring-roslyn repository, where you can find all the samples from this article (and more).
Until next time, ✌